

With an outsize influence on the global economy, the tech industry leads when it comes to job growth. Tech jobs in the U.S. are projected to grow at twice the rate of the overall workforce in the next decade, and other countries aren’t far behind. Keeping up with growth is a top challenge for technology recruitment teams. Looking at technology benchmark recruiting metrics will help them see where they fit into the bigger picture, determine whether their own metrics are leading or lagging, and decide what interventions they can make.
Recruiting Benchmarks 2025 Report
For our landmark Recruiting Benchmarks 2025 Report, SmartRecruiters examined nearly 90 million applications for 1.5 million jobs across 95 countries. This blog post dives into the technology industry metrics, offering a starting place for organizations to see where they’re performing well and where they can improve.
Note that technology industry is defined at the company level, not the job level. In other words, the data includes all roles offered by technology companies in the sample, from customer service representatives to software engineers.
Here are the top takeaways.
Applicant competition
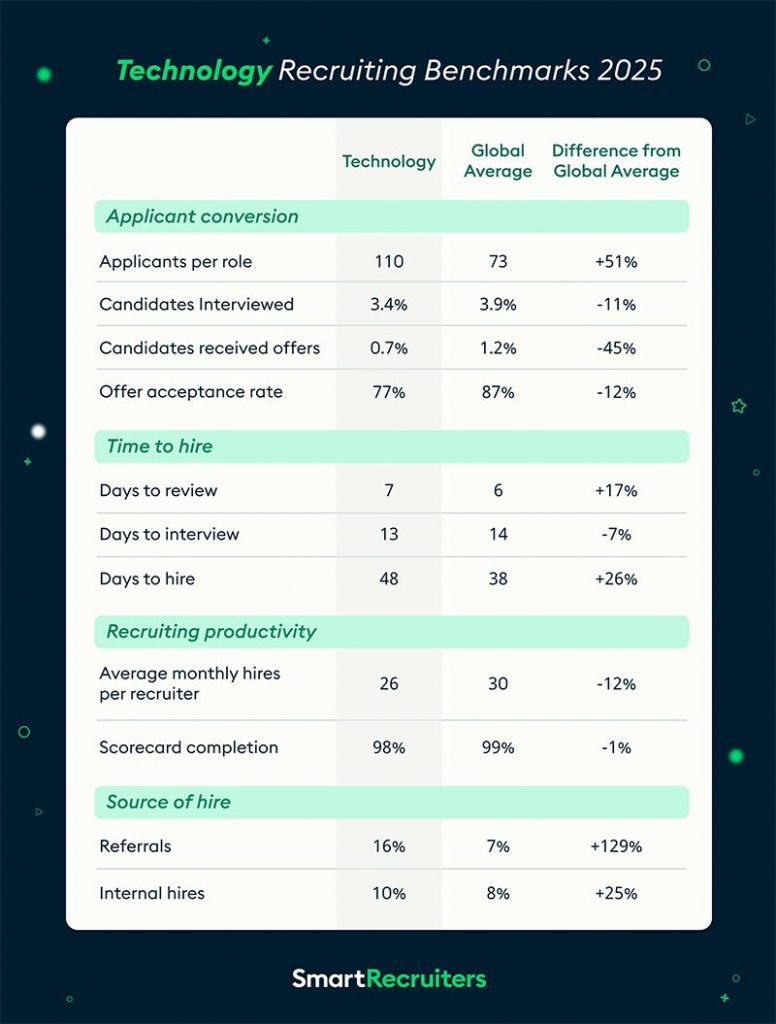
- Compared to other industries, technology employers receive 51% more applications per opening, at 110 applications per hire. Candidates in the industry have an 11% lower chance of getting an interview, but an even smaller chance of getting an offer, at just 0.7%, 45% less than the average for offers across all industries.
- Only 3 in 4 technology candidates accept the offer (77%), 12% below the global average. With lower turnover than many industries and remote/hybrid work increasing interview availability, it’s no surprise that candidates shop around in search of the best offers.
Time to hire
- It can take a long time to get hired in technology, with median hiring times of 48 days to hire, 26% slower than the global median across all industries. While tech companies take about average time to review applications and set interviews, they lag at the decision stage, taking 10 days longer than average between the interview and offer.
- Technology organizations could potentially speed up time to hire by using AI; SmartRecruiters’ research uncovered that teams using AI hire 26%, or 11 days faster than those that don’t use it.
Recruiter productivity
- Tech recruiters tend to be hands-on, handling 26 requisitions per month per recruiter, 12% fewer than those in other industries.
- For technology teams that use hiring scorecards, adoption is almost universal. Rating candidates on key criteria helps streamline hiring decisions when interviewing technology candidates at scale.
Sources of hire
- The technology industry excels in its use of referrals and internal hires, relying on referrals for 16% of hires, or 129% greater than the global average. Technology employers also are strong in their use of internal hires, using them 25% more than average to fill roles.
Technology recruiting case study
During a period after a merger and struggling to manage rapid growth, Xplor Technologies had multiple systems supporting its global talent practices across nine countries. By implementing SmartRecruiters, Xplor was able to streamline its practices, create a single source of truth, and become a truly data-driven TA function. The company was also able to achieve 23% of hires from employee referrals.
“During our hypergrowth period, SmartRecruiters allowed us to hire faster without compromising on candidate quality. By standardizing our hiring practices and attracting high-quality talent, we’ve become a true force in scaling our business.”
– Kara Ayers, SVP, Global Talent Acquisition, Total Rewards and Inclusion, Xplor Technologies
Get more recruiting benchmark metrics
Download the full report to get a global overview of hiring benchmarks plus insights on geographic differences in hiring across the United States, United Kingdom, France, Germany, and Australia.